Effect
Increasing Sea Surface Temperatures
While sea surface temperatures vary regionally, they have been higher during the past three decades than at any other time since reliable data collection began in 1880. As a province with a close connection to the sea, these changes will be particularly noticeable in Newfoundland and Labrador.
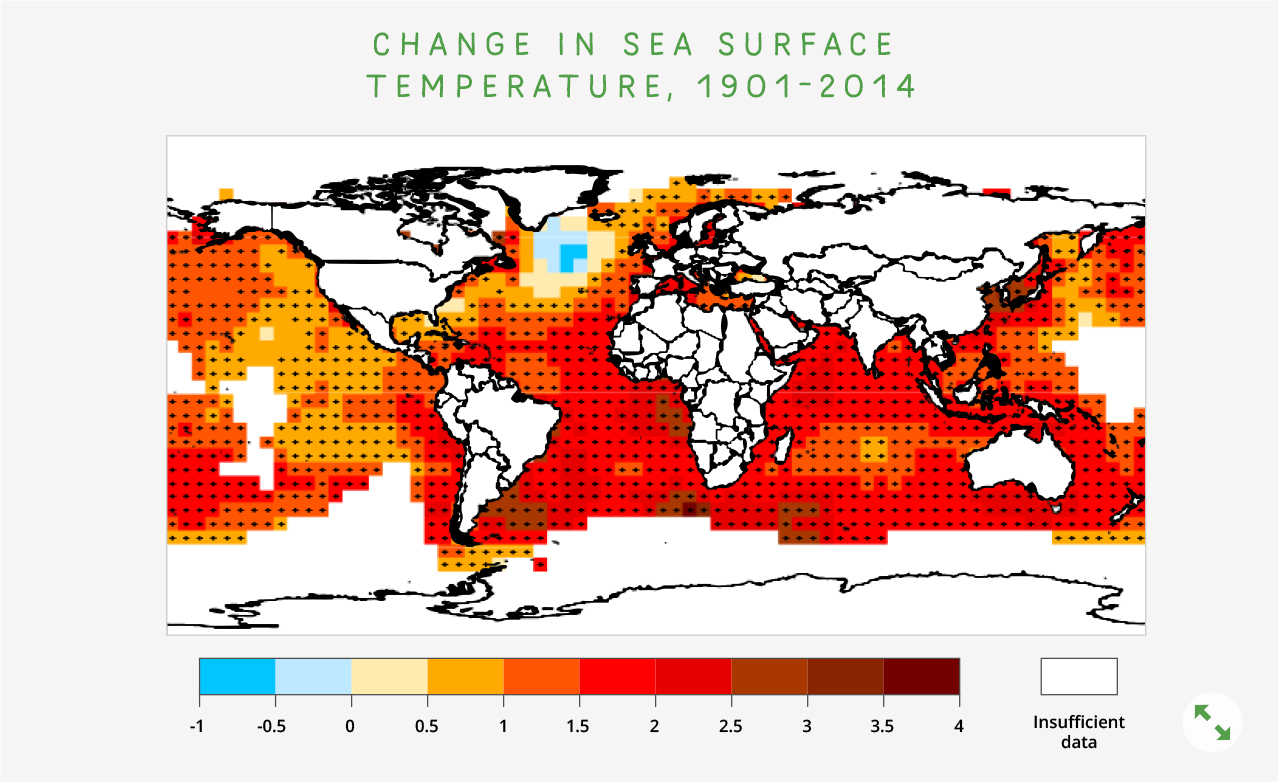
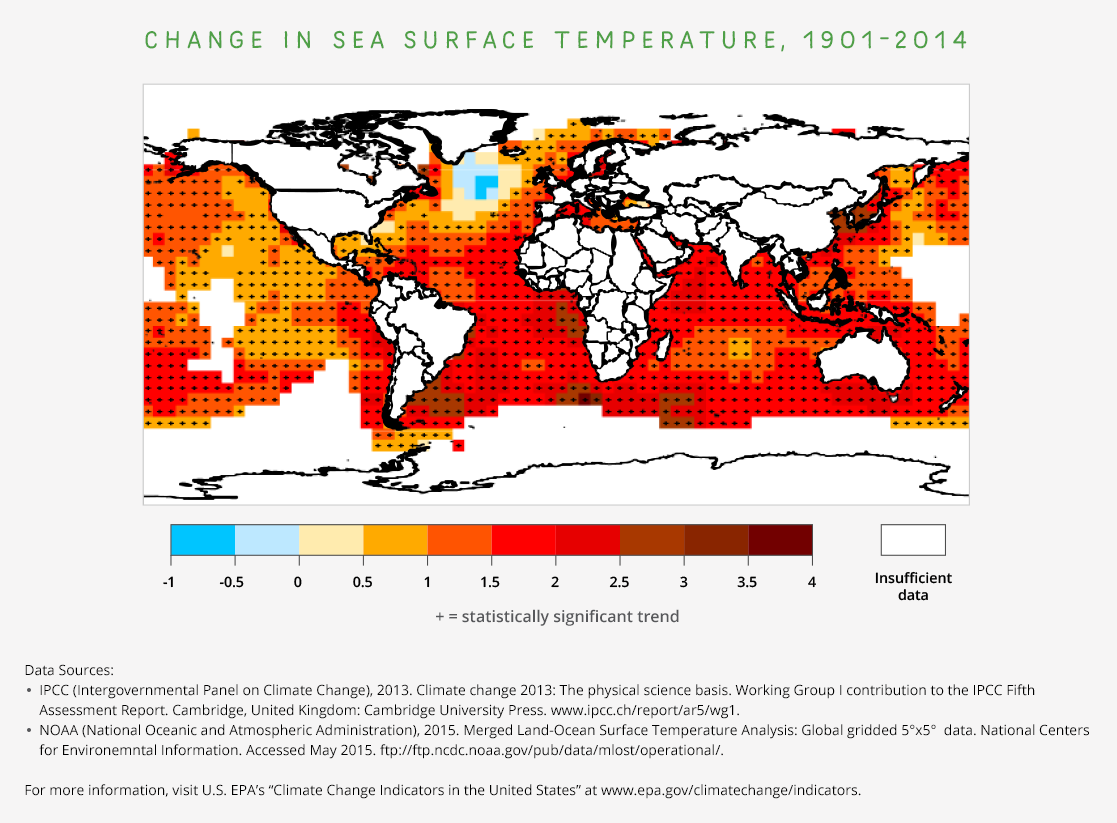
The map below from the U.S. Environmental Protection Agency shows how average sea surface temperatures around the world changed between 1901 and 2014. It is based on a combination of direct measurements and satellite measurements. A black "+" symbol in the middle of a square on the map means the trend shown is statistically significant. White areas did not have enough data to calculate reliable long-term trends.